This is a guide on how to set up debugging in a Blender Add-on version 2.80 or higher using PyCharm.
I used this guide: https://code.blender.org/2015/10/debugging-python-code-with-pycharm/
to set up debugging.
Important: You need Pycharm Professional for debugging Blender because it requires the remote debugging feature which isn't available in community edition in 2019 or lower.
1. Install the remote_debugger Blender add-on
Sybren A. Stüvel has developed a Blender Add-on called Remote debugger which is what makes the remote debugging possible.
The add-on can be found here:
https://github.com/sybrenstuvel/random-blender-addons/blob/master/remote_debugger.py.
After downloading the file, do these steps in Blender: open preferences menu -> Add-ons -> Install... -> Select the remote_debugger.py file -> Click install Add-on

I created a folder called remote_debugger in my Blender Add-on project so I can easily find the file if I need it again.
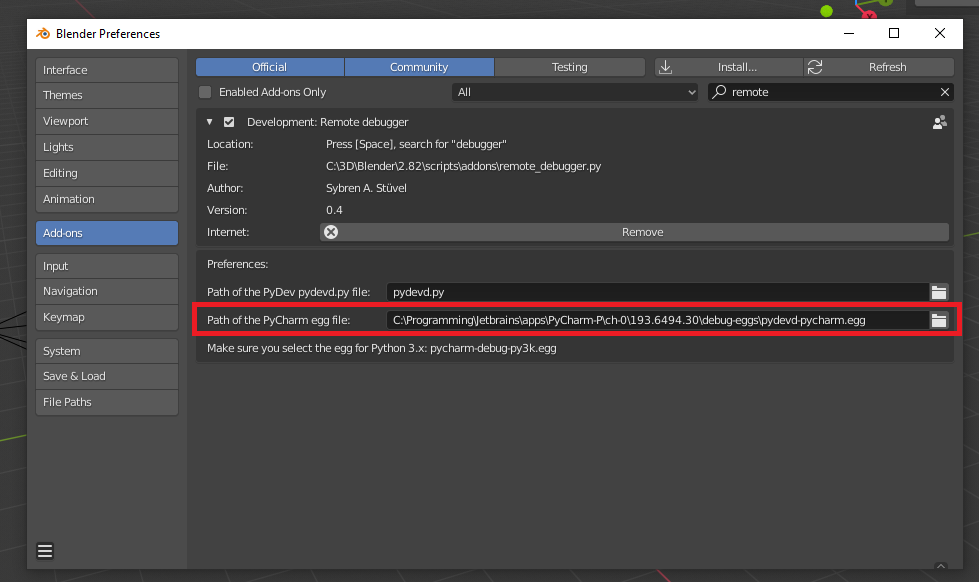
2. Configure the add-on with the pycharm.egg file.
Now that the remote_debugger add-on is installed we need to tell the add-on where the PyCharm egg file is.
For me that was at:
C:\Programming\Jetbrains\apps\PyCharm-P\ch-0\193.6494.30\debug-eggs\pydevd-pycharm.egg .
3. Create the PyCharm debug configuration.
To create the remote debug configuration in PyCharm:
Run -> Edit Configurations ... -> Expand Templates -> Python Remote Debug -> Set port to 1090 -> Click Create Configuration -> Change the name from "Unnamed"

If you need to edit the configuration go to Edit Configurations ... again to change the name, edit port or the local host name.
4. Run the PyCharm debug configuration
The next step is to start the remote debugger so that PyCharms listens for pydevd_pycharm.settrace() statements in the code.
Just click Run -> Debug ... and then choose the configuration you created in the previous step.
In the future you can just click Run -> Debug "name" to quickly start it.

5. Connect to remote debugger in Blender
This is where we need to use the remote_debugger add-on in Blender to connect to PyCharm.
With default keyboard settings you'd do the following where F3 is the "Search Menu" keymap binding:
F3 -> search for "pycharm" -> Select "Connect to remote PyCharm debugger"
Then the Blender freezes for about a second and it should show up in PyCharm that something has connected and you will see a lot of the console output of Blender.

This is how it looks like when I connected from Blender to PyCharm:

When I upgraded from Pycharm 2019.3 to 2020.1 the debugger stopped working for me.
It gave me the error Expected: C:\...\debug-eggs\pydevd-pycharm.egg\pydevd_attach_to_process\attach_amd64.dll to exist.
This was solved by renaming the .egg file to .zip and unzip the content and then rename that folder to pydevd-pycharm.egg.
More information: https://youtrack.jetbrains.com/issue/PY-43558

6. Add pydevd_pycharm.settrace() in code
All that's left is to add import pydevd_pycharm; pydevd_pycharm.settrace() in the code and a breakpoint will happen and you can debug the code and step over or into functions and so on.
The reason for inlining import pydevd_pycharm; before calling the settrace() method is that if you declare it at the top of the file, then blender might throw an import module error.

This is how it looked like in PyCharm for me when the breakpoint was hit and trying to see what value the variable layout had:

More reading
Other Blender Add-on related blog posts by me that may be of interest:
No comments:
Post a Comment